Quelle: VDZ

Zementmarkt und Baukonjunktur
Wie viel Zement wird in Deutschland verbraucht? Was wird aus dem Zement hergestellt? Wie entwickelt sich die Baunachfrage? Diese und weitere Informationen finden Sie hier.
Inlandsversand der VDZ-Mitglieder
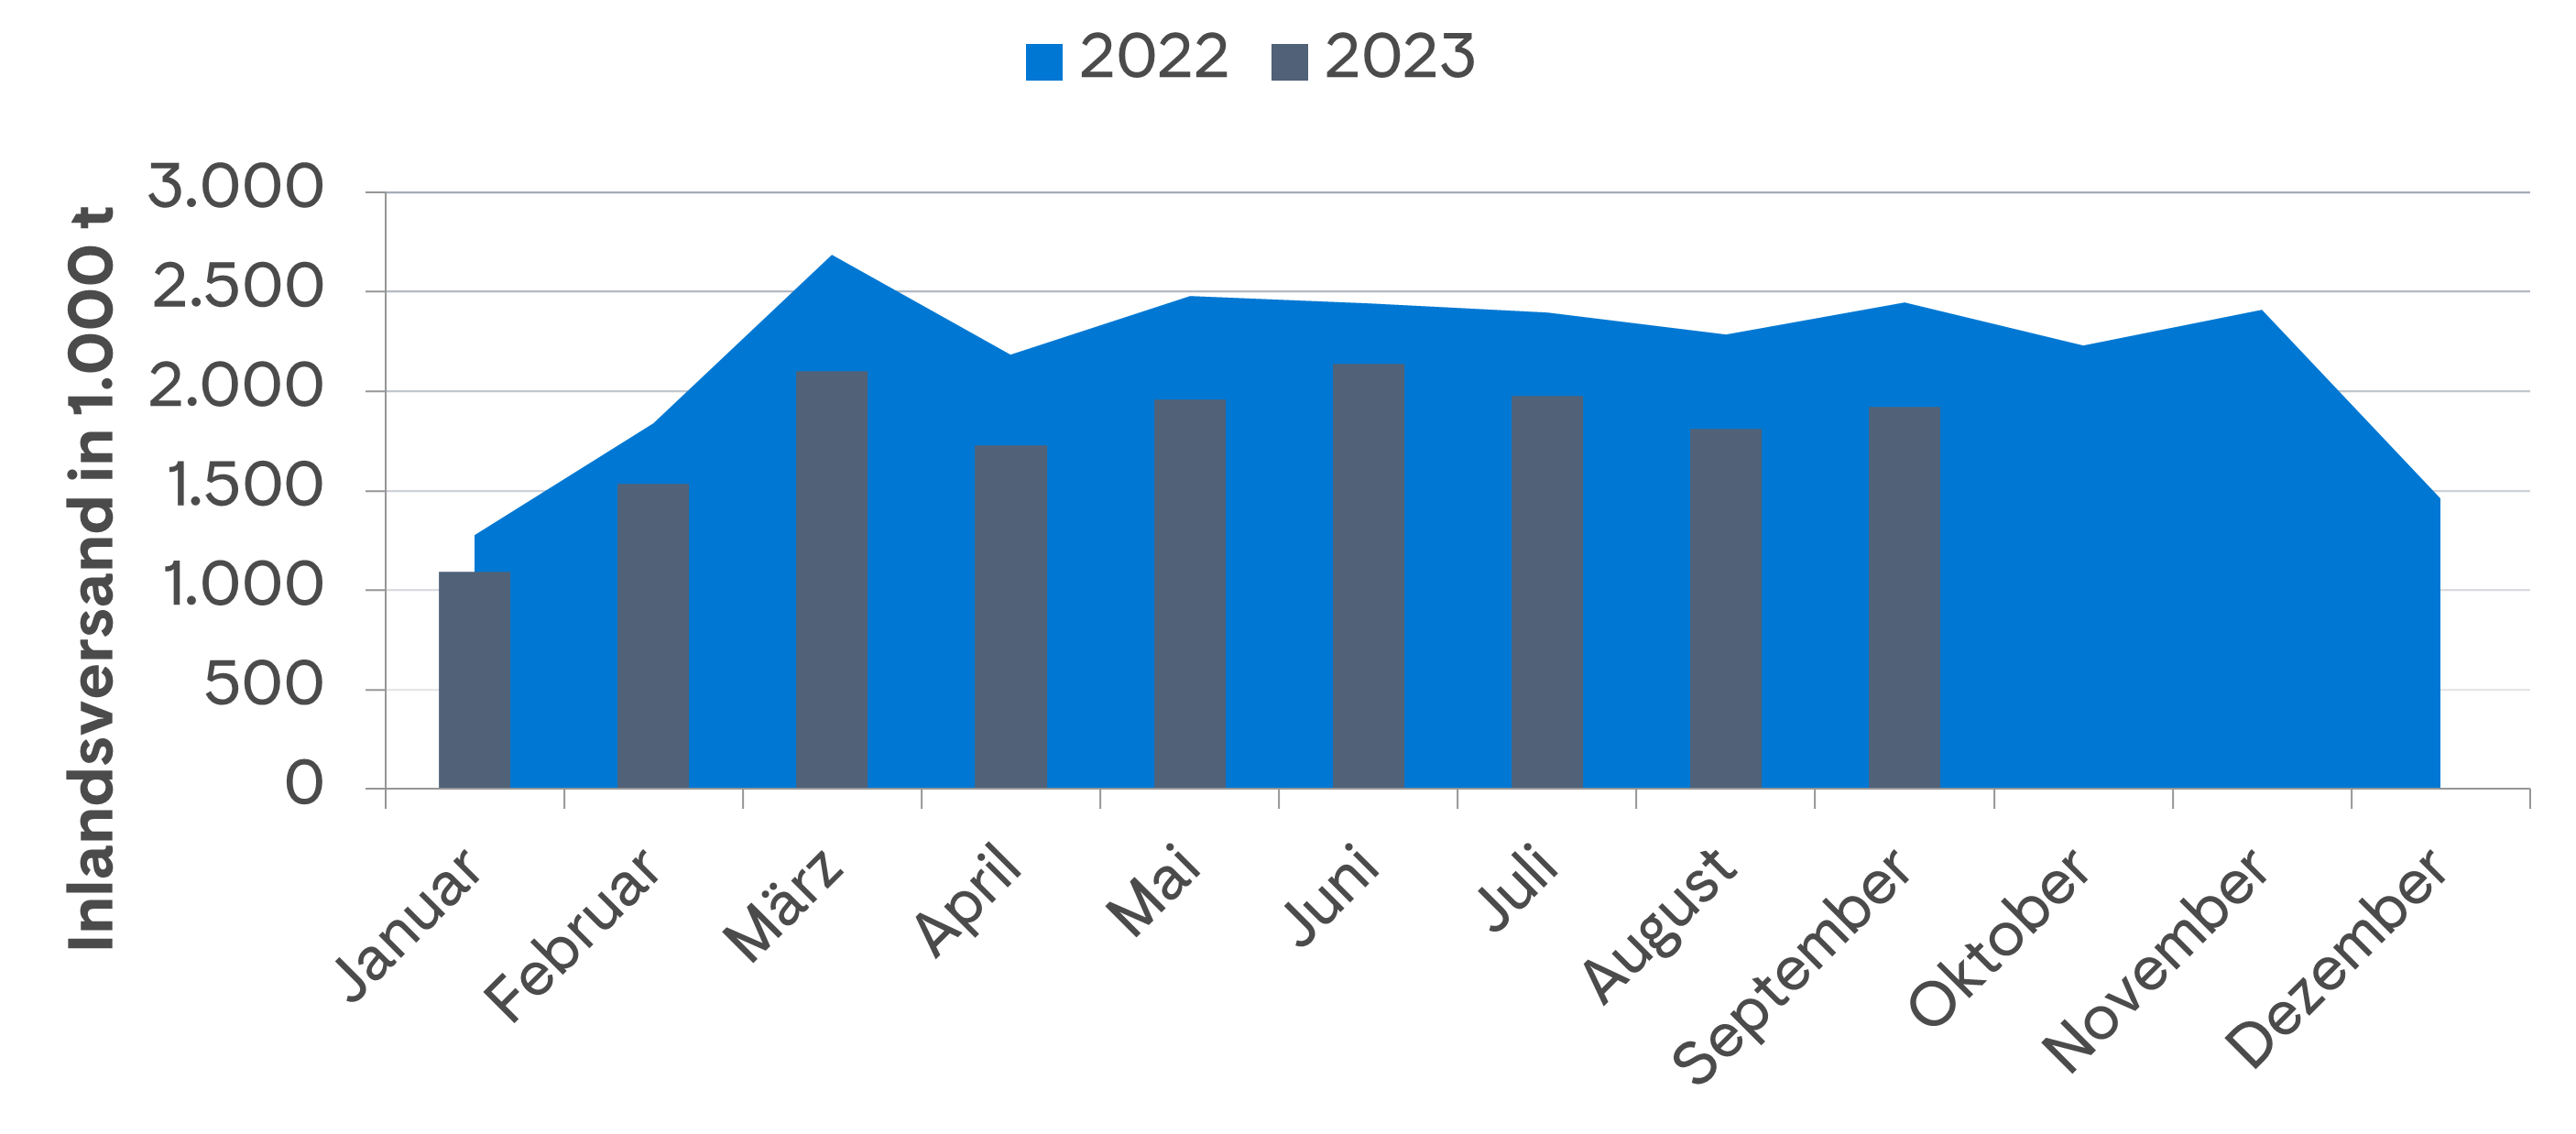
Inlandsversand der VDZ-Mitglieder
| Monat | Inlandsversand 2024 in t | Veränderung zum Vorjahr | Inlandsversand 2024 in t (kumuliert) | Veränderung zum Vorjahr |
| t | % | t | % | |
| Januar | 712.813 | -34,8 | 712.813 | -34,8 |
| Februar | 1.428.415 | -7,0 | 2.141.228 | -18,6 |
| März | 1.649.997 | -21,5 | 3.791.225 | -19,9 |
| April | 1.814.435 | +4,9 | 5.605.660 | -13,3 |
| Mai | 1.639.167 | -16,4 | 7.244.827 | -14,0 |
| Juni | 1.803.797 | -15,7 | 9.048.624 | -14,3 |
| Juli | 1.963.480 | -0,8 | 11.012.104 | -12,2 |
| August | 1.650.776 | -8,9 | 12.662.880 | -11,8 |
| September | 1.795.637 | -6,6 | 14.458.517 | -11,2 |
| Oktober | 1.890.963 | +3,0 | 16.349.480 | -9,7 |
| November | 1.708.861 | -3,5 | 18.058.341 | -9,2 |
| Dezember | - | - | - | - |
Quelle: VDZ
Erzeugerpreisindex Zement
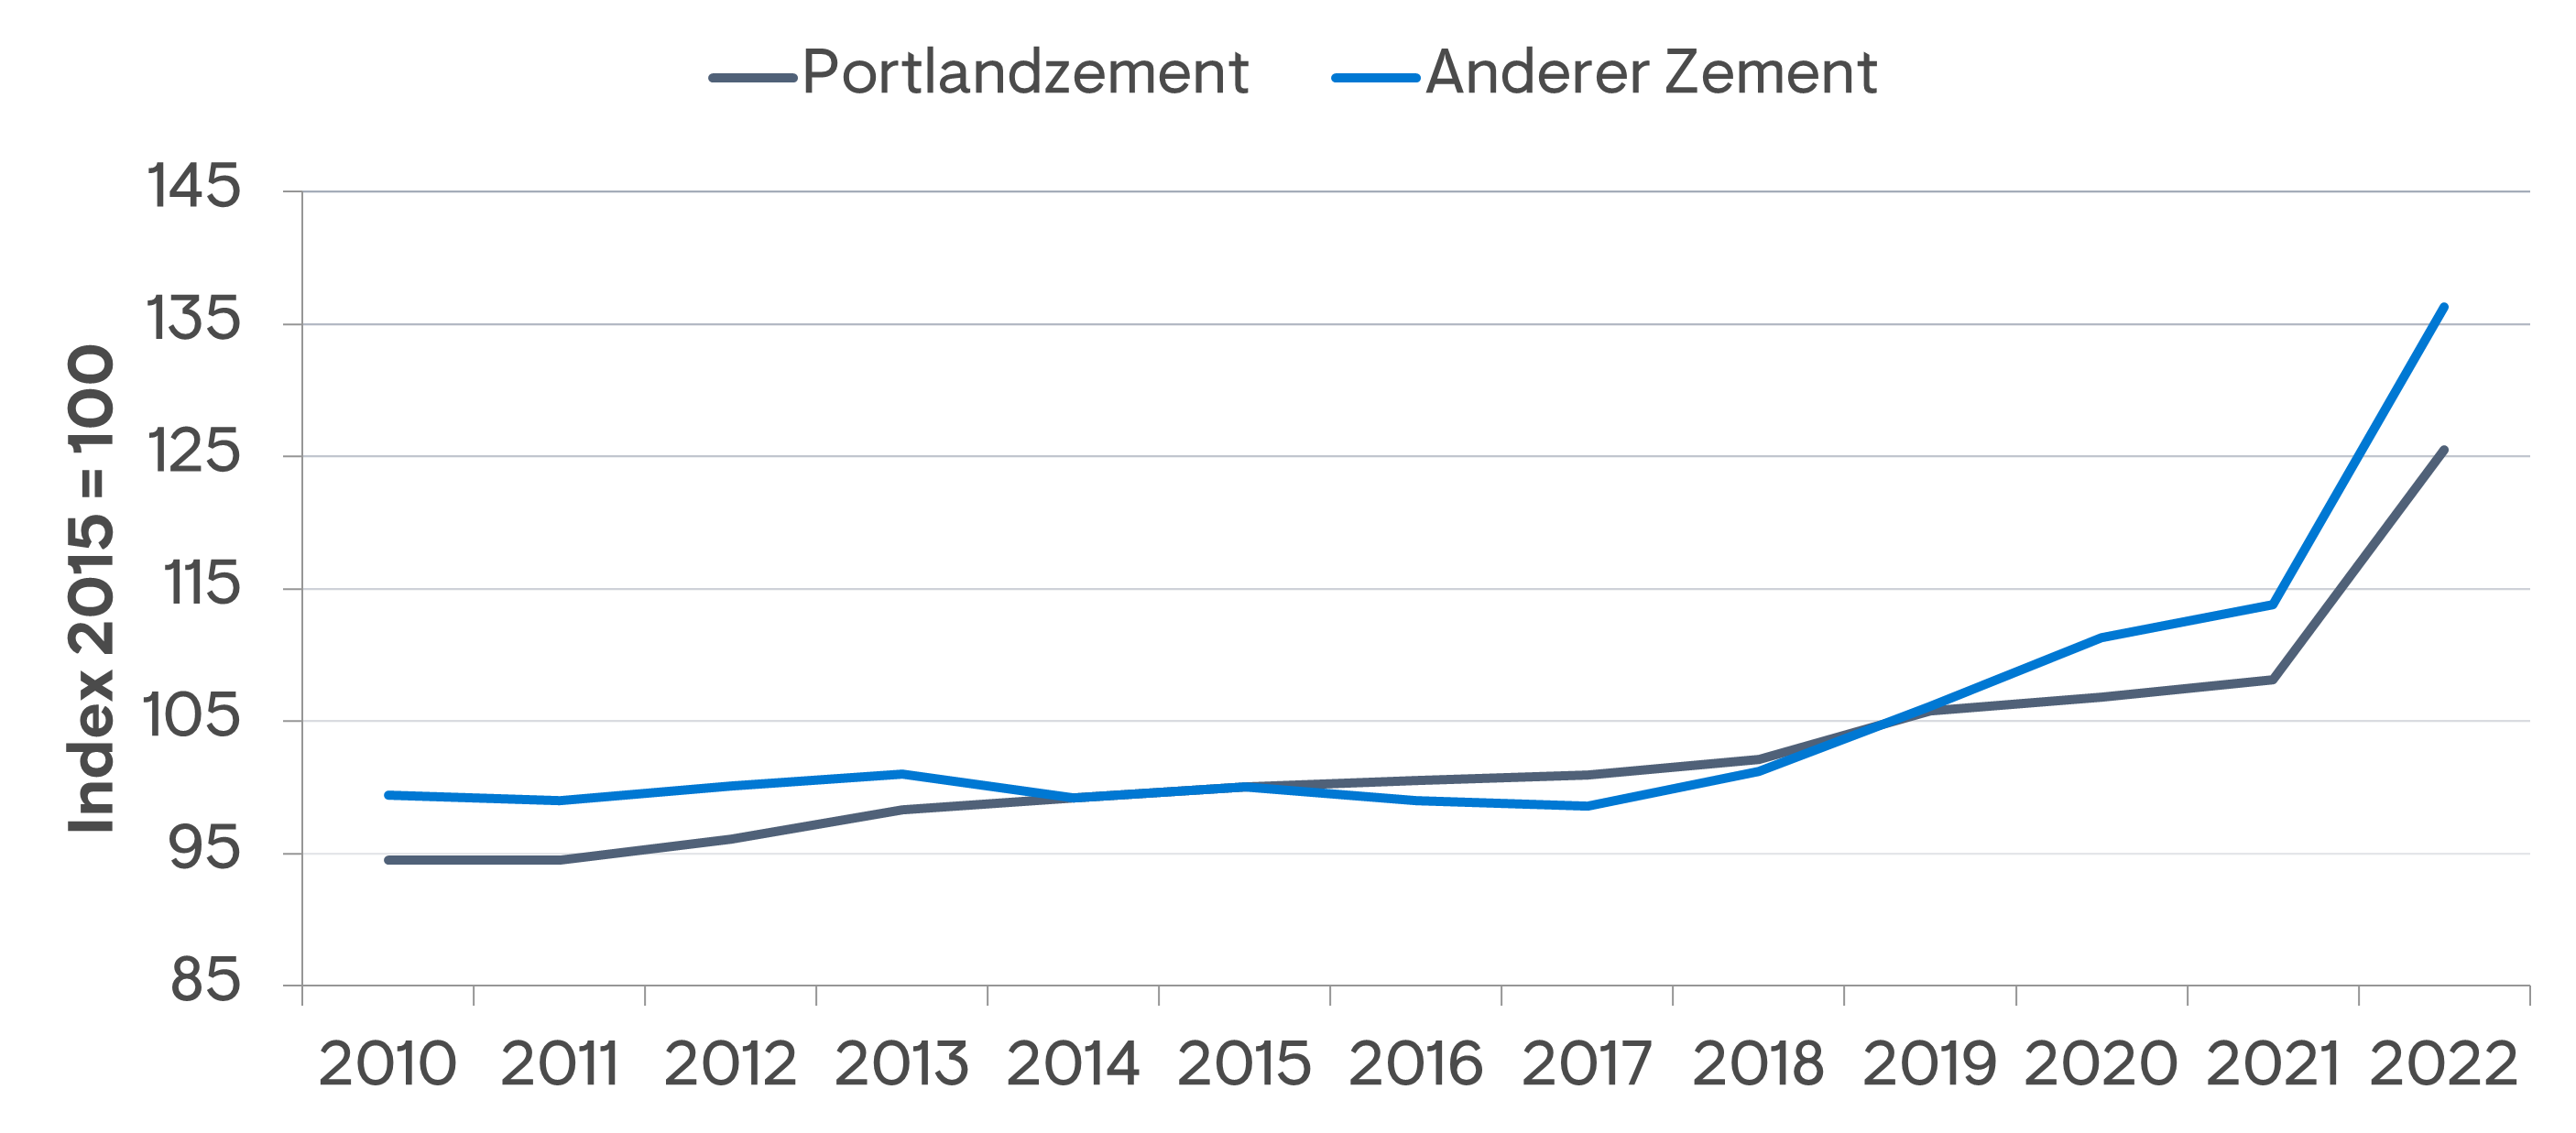
Quelle: Statistisches Bundesamt
Zementverbrauch in Deutschland
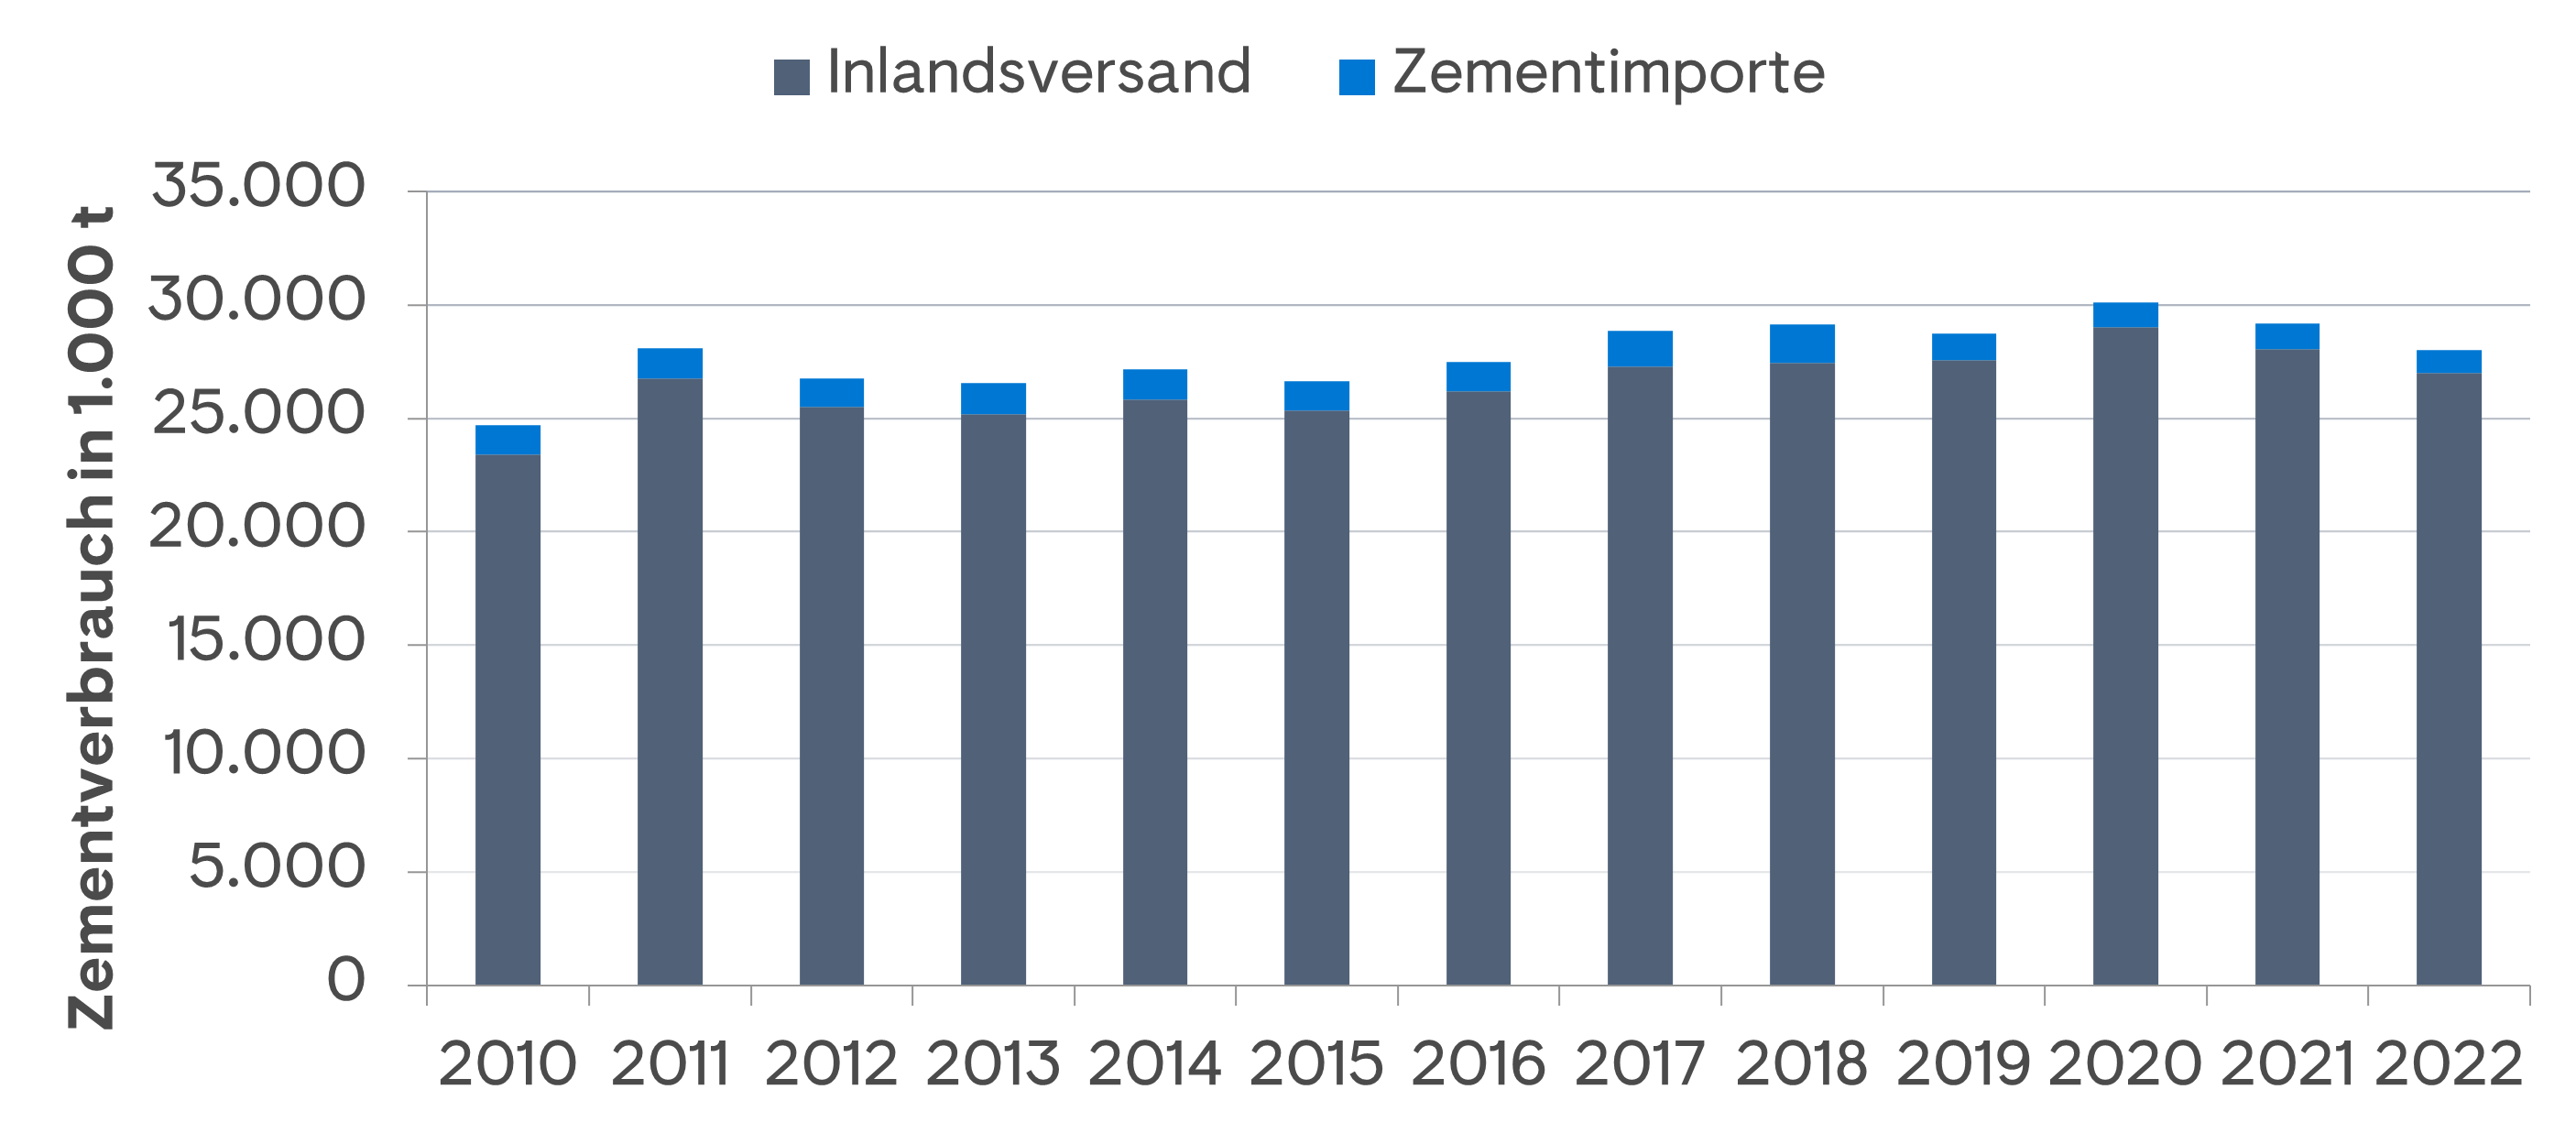
Quelle: VDZ, Statistisches Bundesamt
Zementmärkte in Europa 2018

Quelle: VDZ, CemNet
